Graphs
Graphs
Every day, a mysterious line graph appears with no labels. Your mission: figure out which real-world dataset it represents from a handful of tempting options. It's a sharp blend of visual pattern recognition, real-world knowledge, and that satisfying 'aha' when the trends suddenly click.
Play on Official Site
What is Graphs?
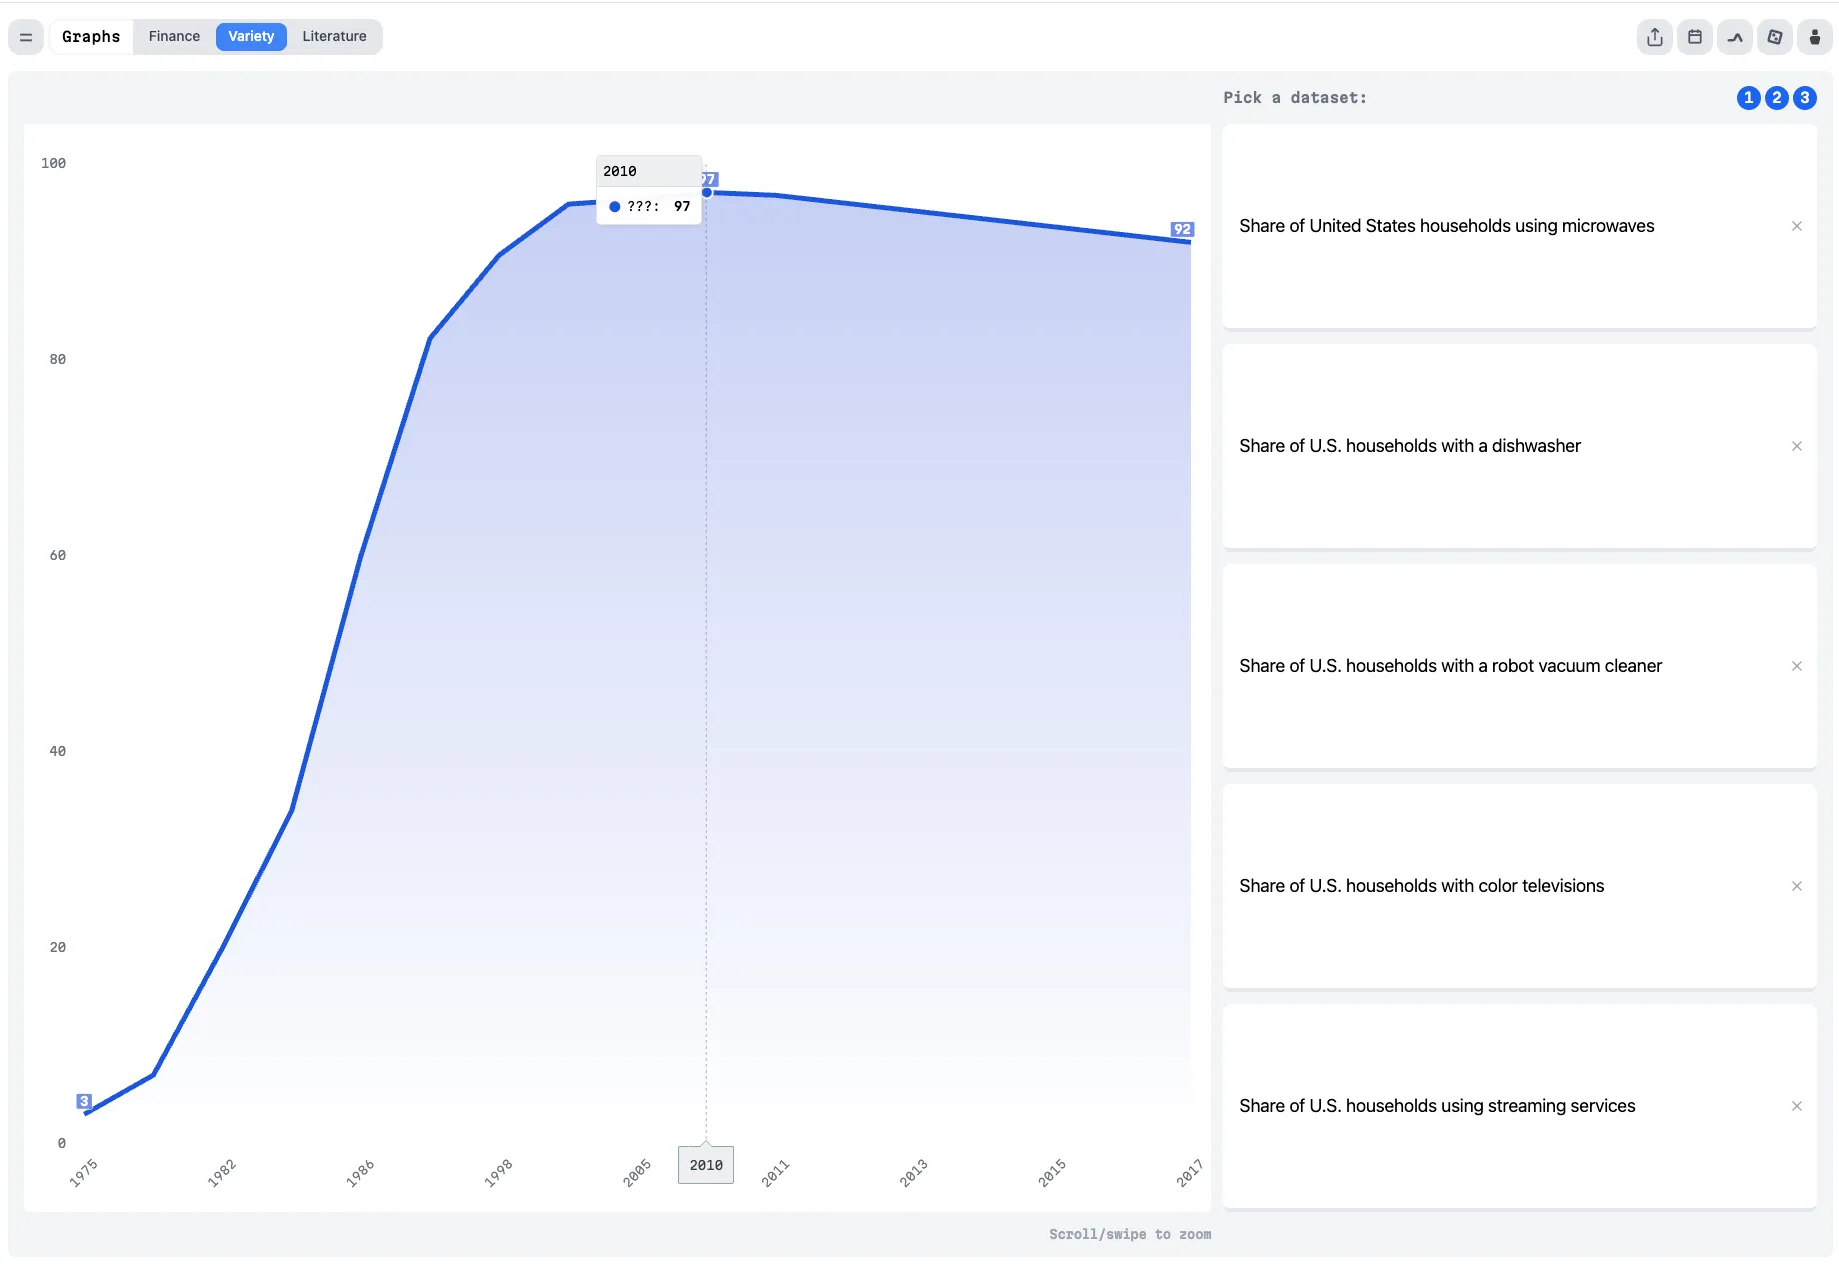
A silent line chart stares back at you—axes, numbers, and a single mysterious curve with spikes, dips, and plateaus. No titles. No legends. Just pure visual data. Your job is to identify which real-world dataset it secretly represents from a short list of options.
This daily brain-teaser turns data visualization into an addictive detective game. It's challenging because the same upward trend could mean smartphone adoption, ice cream sales, or global temperatures—only sharp observation and a dash of worldly knowledge will reveal the truth. Perfect for puzzle fans who love Wordle-style daily rituals but crave something more analytical and surprising.
Graphs Game Rules (The Catch / The Trap)
You are shown one unlabeled real line graph each day. On the side, a small set of dataset descriptions appear (typically 3–5 options).
- Study the shape: Look for dramatic rises, sudden crashes, long flatlines, seasonal waves, or exponential curves.
- Match the trend: Pick the option whose real-world behavior best fits the visual story.
- Limited attempts: You usually have a few tries before the puzzle locks (exact number varies slightly by version but success feels earned).
- Real data only: Every graph is pulled from actual statistics—no made-up numbers.
Wrong guesses eliminate options and sharpen your focus. Win, and you unlock the full dataset, sources, and context to satisfy your curiosity.
How To Play Graphs?
Step 1: Absorb the graph
The daily line chart loads. Scan the axes for time range and scale. Notice key moments: a steep climb around 2020? A flat decade then sudden spike? Zoom if available.
Step 2: Read the options
Review the list of dataset titles (e.g., "U.S. Microwave Ownership", "Global Renewable Energy Capacity", "Average Daily Steps Tracked by Fitness Apps").
Player Action: Click or select the option you believe matches the line.
Game Response: Correct? Victory screen with full data reveal and stats. Wrong? Option eliminated or feedback given—try again with fresh eyes.
Step 3: Refine with clues from misses
Each incorrect choice removes a distractor. Re-examine the graph: does that early plateau rule out volatile data? Does the late surge point to pandemic-related trends?
Step 4: Lock in your final guess
When the shape and real-world logic align, submit. Celebrate your streak and explore the archive of past puzzles.
What You Learn Next: Real statistics behind the graph, plus how your pattern-reading skills stack up against other players.
Strategy & Tips
- Train your eye for signature shapes: exponential growth, cyclical waves, or crash-and-recovery patterns.
- Think contextually: What major events (tech booms, recessions, pandemics) could explain the movement?
- Don't overthink outliers—focus on the overall trend.
- Play daily to build intuition; the more graphs you decode, the faster your "data sense" develops.
Graphs rewards both visual intuition and curious minds who enjoy turning charts into stories.